
An announcement for an Introduction to R course arrived in my inbox recently, so I checked it out. The course is free, and offered by the Knight Center for Journalism. There are lots of tweets about R, and how awesome it is, so I signed up. Did I make a big mistake, or will this be a good investment of my time? Will it complement Excel?
Course Details
The full title of the course is, “Intro to R for Journalists: How to Find Great Stories in Data.” You can register, and see the course details on the JournalismCourses.org site.

The course has 5 modules, and runs for 5 weeks, from July 23rd to August 26th. There is also an introduction module, which is available now. It has instructions for downloading and installing the free software that you need for the course.
The instructor is Andrew Ba Tran, a Data Reporter for the Washington Post’s rapid response investigative team.
Why I Signed Up
As I mentioned, I see lots of R tweets in my Twitter feed, so this is a good opportunity to learn a bit about it. Here are a few more reasons why I signed up:
- I’m not a journalist, but the course information page says, “We welcome anyone interested in quickly asking questions of and assessing data.” We do that in Excel too, especially with the new Power BI tools. It sounds like R can build queries, similar to what Power Query does. Learning R might help me work better in Power Query too (I’m only a beginner in that).
- The software is free and open source, so there’s no monetary investment – just my time investment in going through the course modules. After a couple of modules, if I find that it’s not worth my time, I can un-enroll from the course.
- Based on the promo video for the course, the instructor, Andrew Ba Tran, seems easy to follow. He spoke well, at a good speed, and didn’t use a bunch of advanced statistical terms, to scared me away.
Replacing Excel
In the Introduction Module, there are a couple of mentions of using R to replace Excel. I’m certainly not looking to do that! The instructor says that you “can’t reuse things in Excel”, but R code can be used on multiple data sources. I guess he hasn’t seen what Power Query can do in Excel.
However, R does seem to have the capacity to create cool charts and maps, without some of the workarounds needed in Excel. Will this course show me ways that R and Excel can work nicely together?
Getting Ready
I’ve gone through the Introduction Module, and that took about and hour and a half. There were clear instructions (video and transcript) for downloading the free software:
- R
- RStudio
- Git
It also showed how to use the Command window to add your name and email in Git. I already have a GitHub account, which we also need, I think.
The course syllabus says that we need an API for the US Census Data, so I got that too, even though it wasn’t mentioned in the Intro Module.
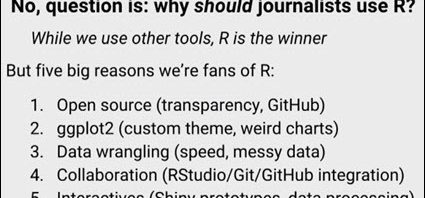
The module has a link to a video with Andrew Flowers, from FiveThirtyEight. He gives 5 reasons why R is helpful in data analysis, and that gave me a good overview of why this course might be helpful to me.

Do You Use R?
If you’re an Excel user, do you also use R? If not, have you ever considered learning the basics of how R works? Did you learn it, and decide not to use it?
Finally, if you’re enrolled in this course, please let me know. I might need to sit beside you, and copy your notes!
___________________